Home / Projects / Website Redesign for City Parks Foundation

Website Redesign for City Parks Foundation

Rethinking the information architecture and visual design for a nonprofit offering park programming.

Website Redesign for City Parks Foundation

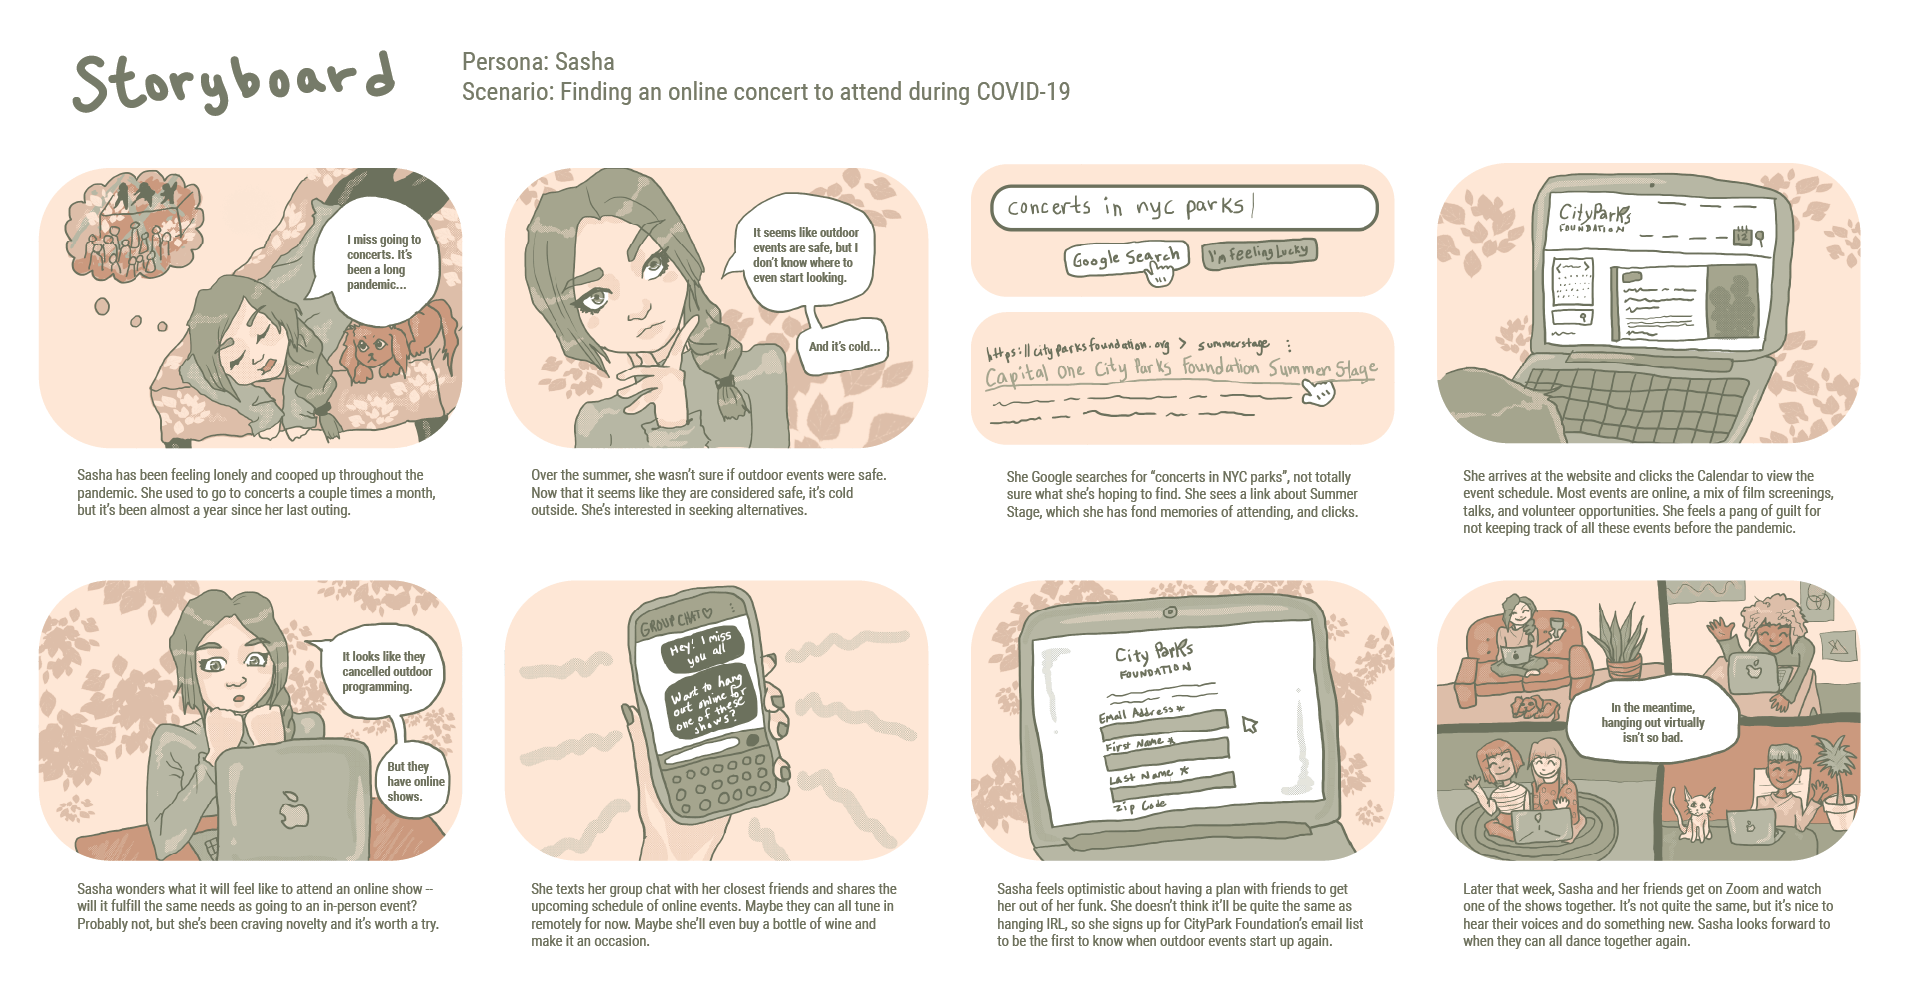
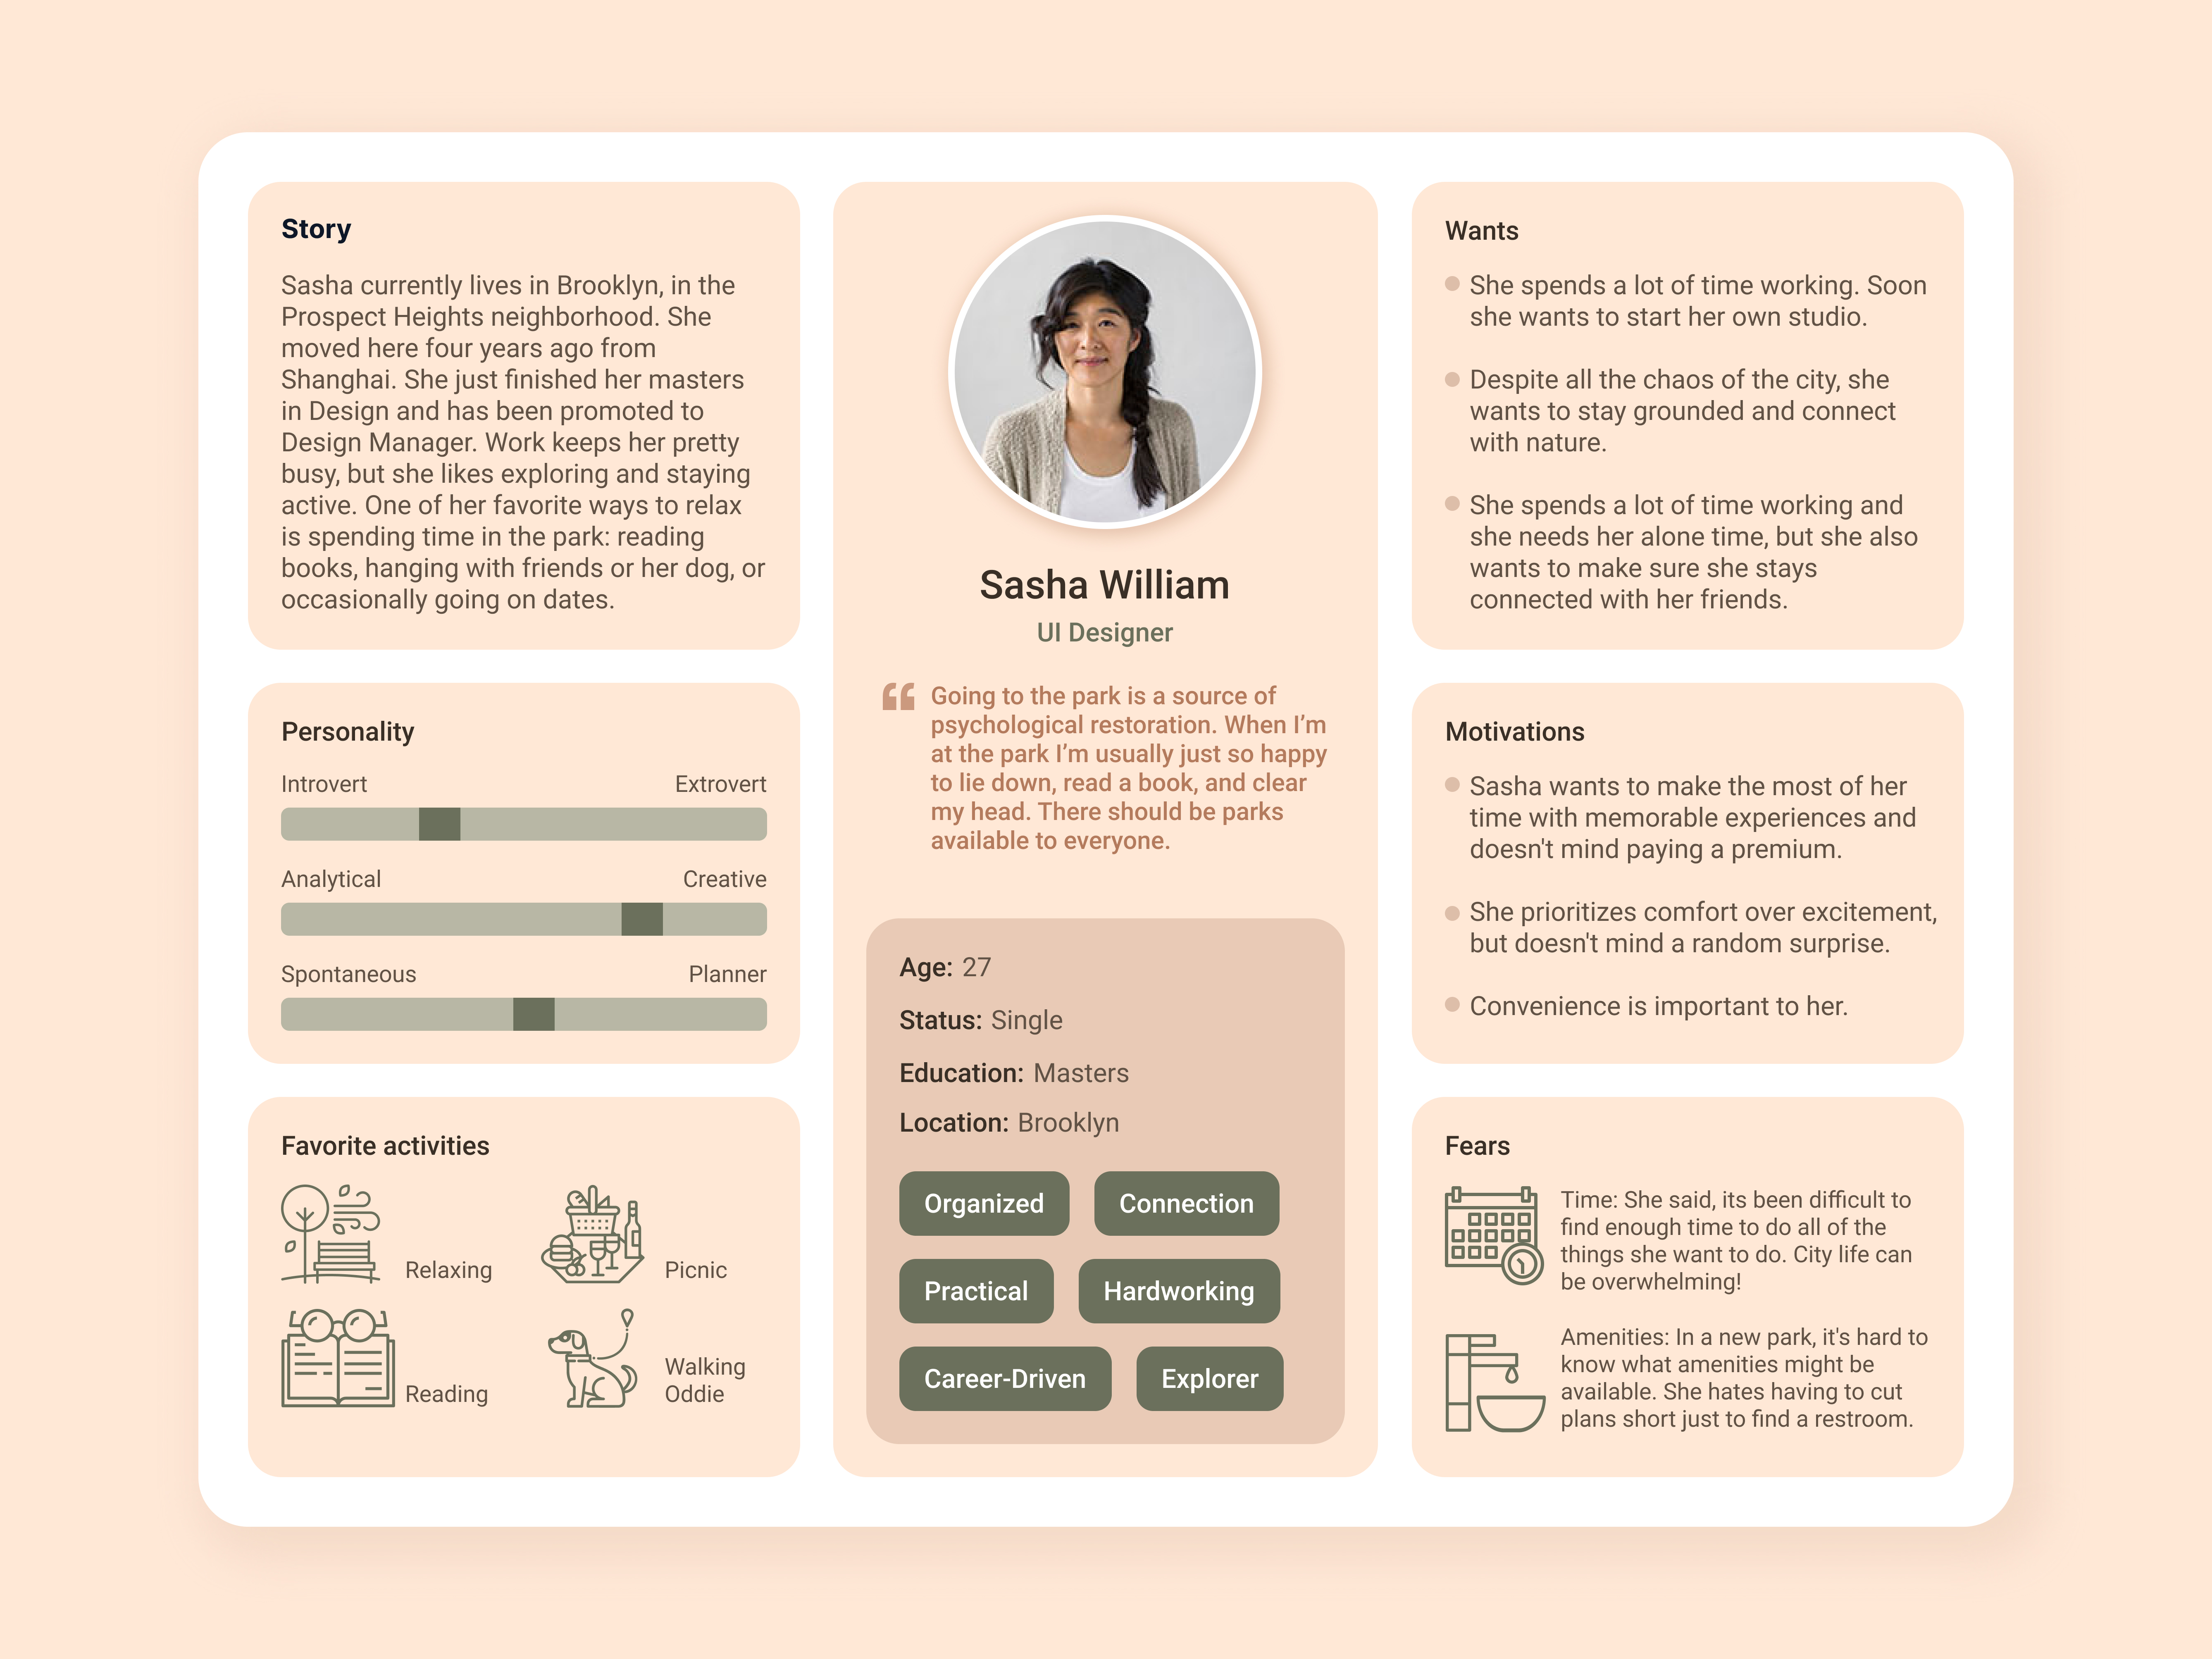
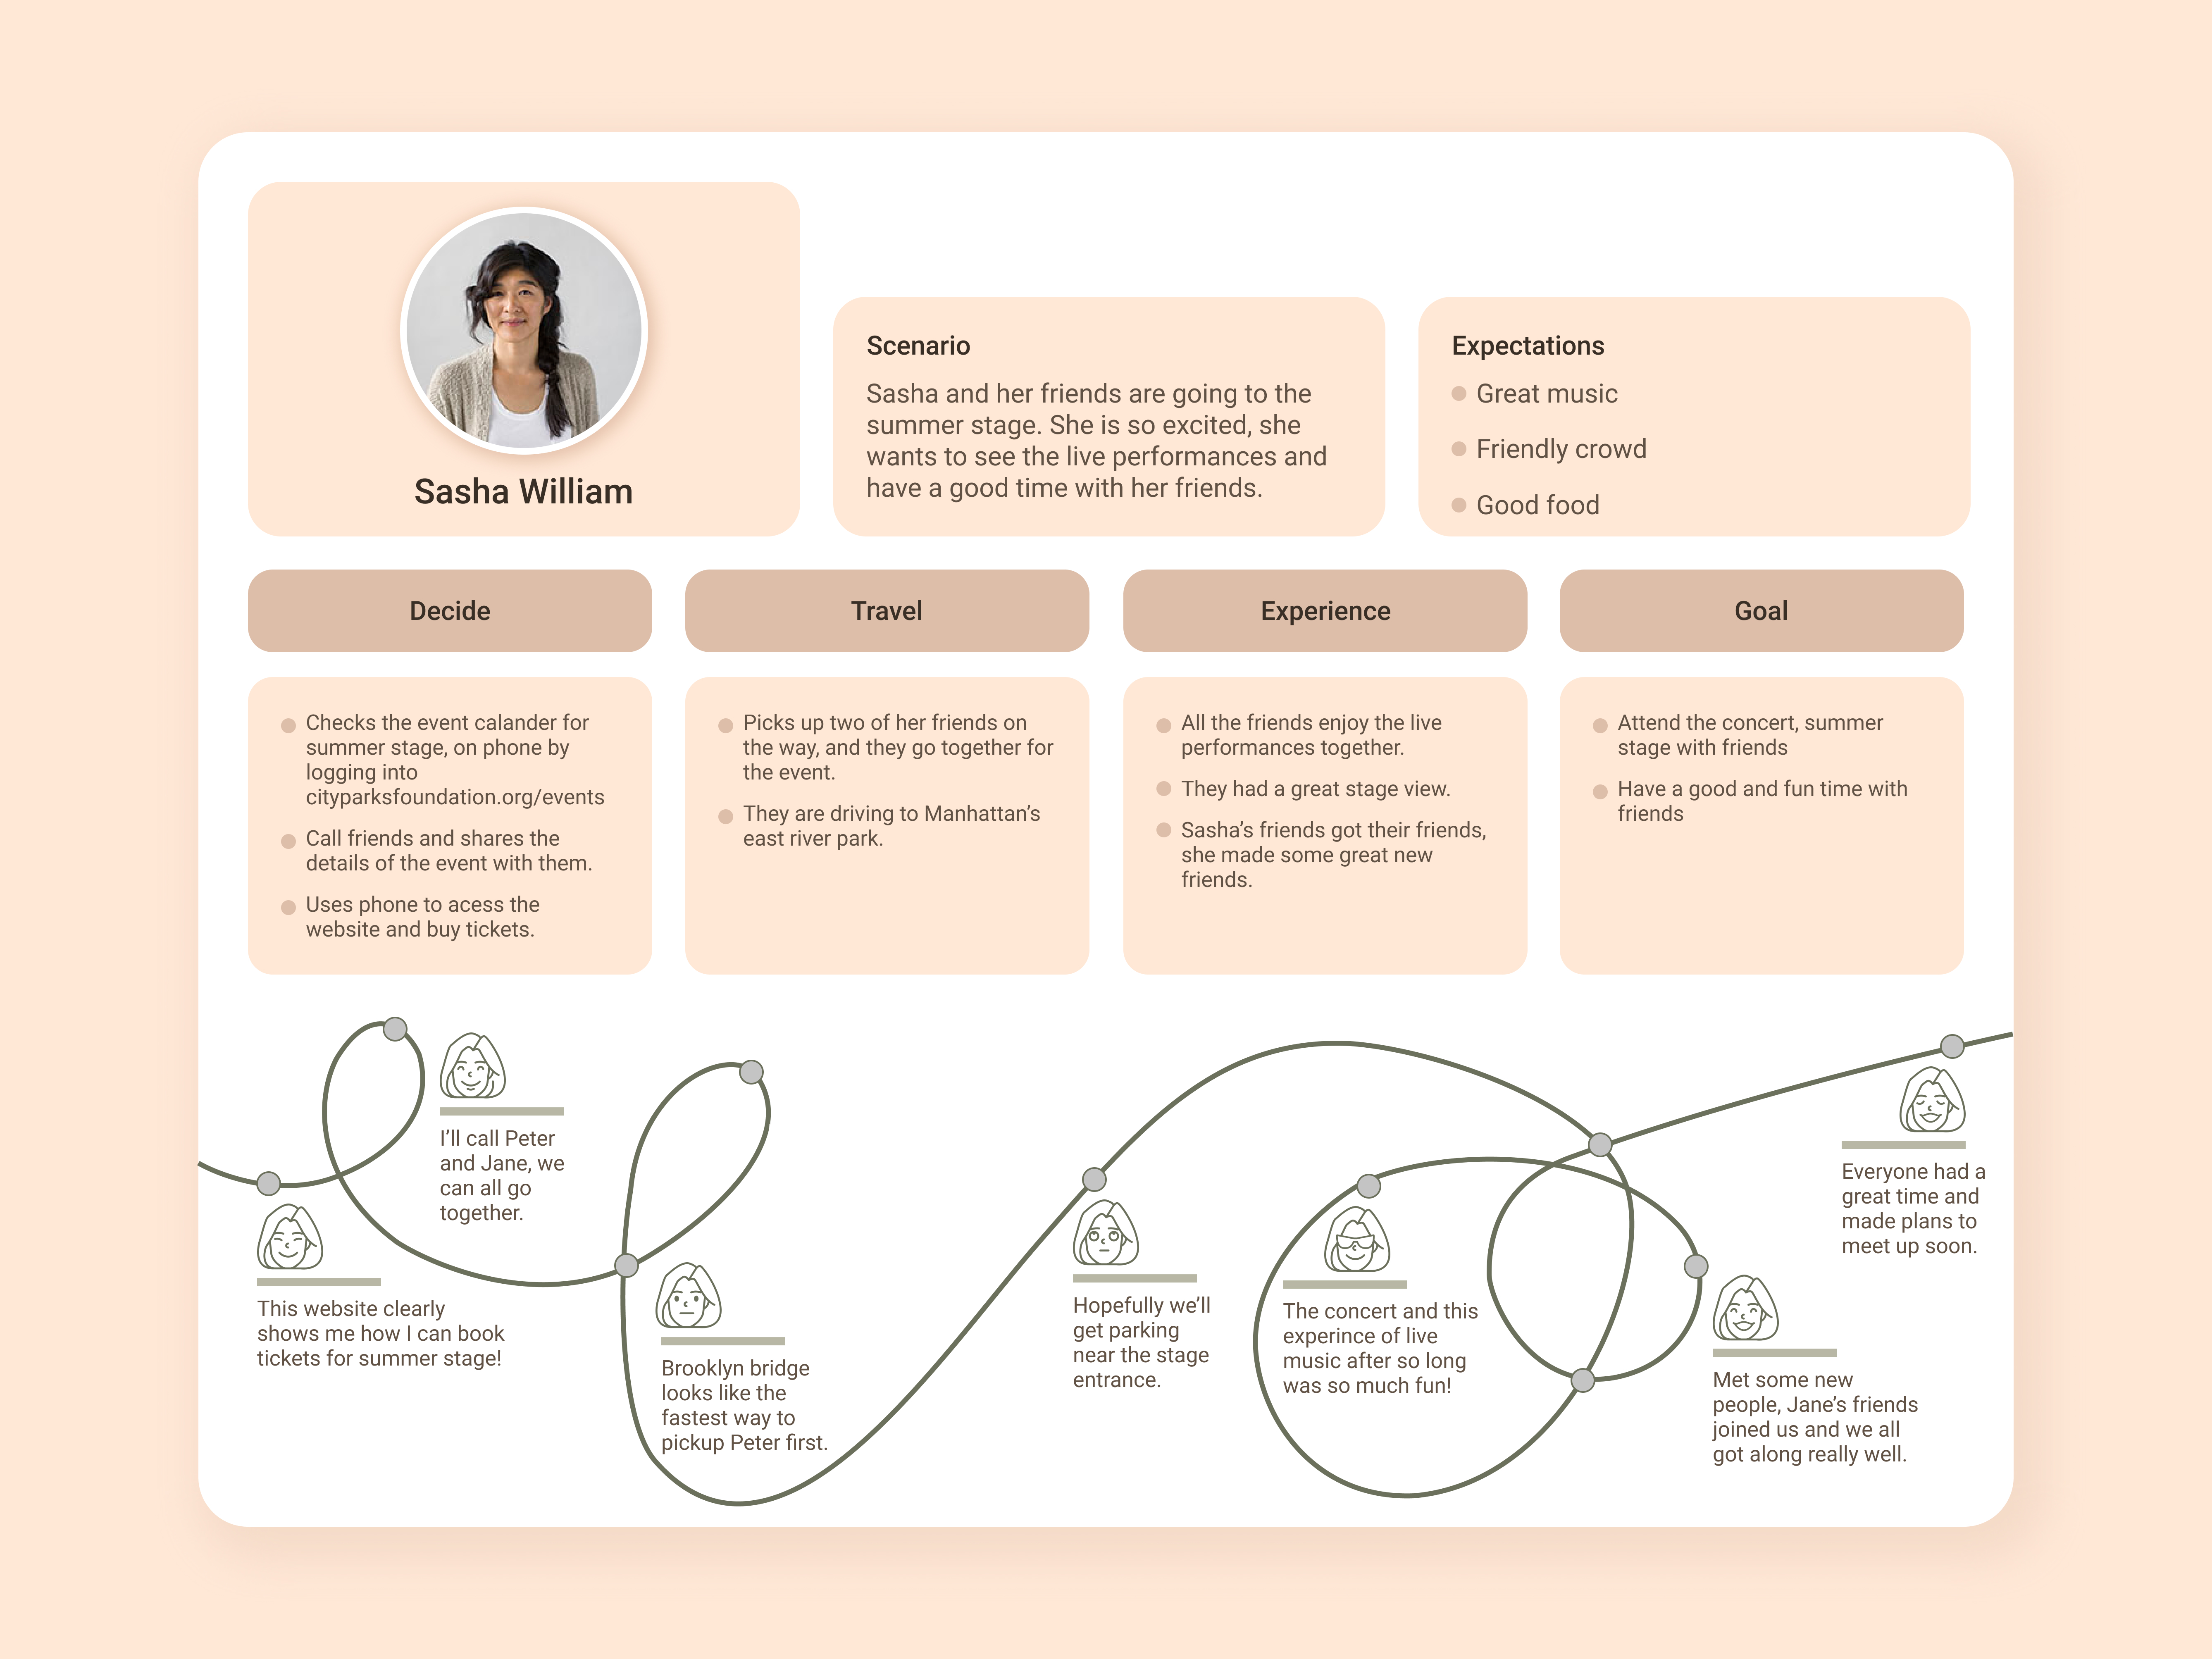
How can a nonprofit organization feel relevant to a millennial crowd? How can a redesign accommodate changes to an organization focused on events during the COVID-19 pandemic, while remaining usable after restrictions have eased?

These were the questions our group of four classmates (myself, Prachi Chhajed, LeMark McPherson, and Kate Nadel) explored in this unsolicited redesign project for City Parks Foundation in New York City for INFO-643: Information Architecture & Interaction Design at Pratt Institute.

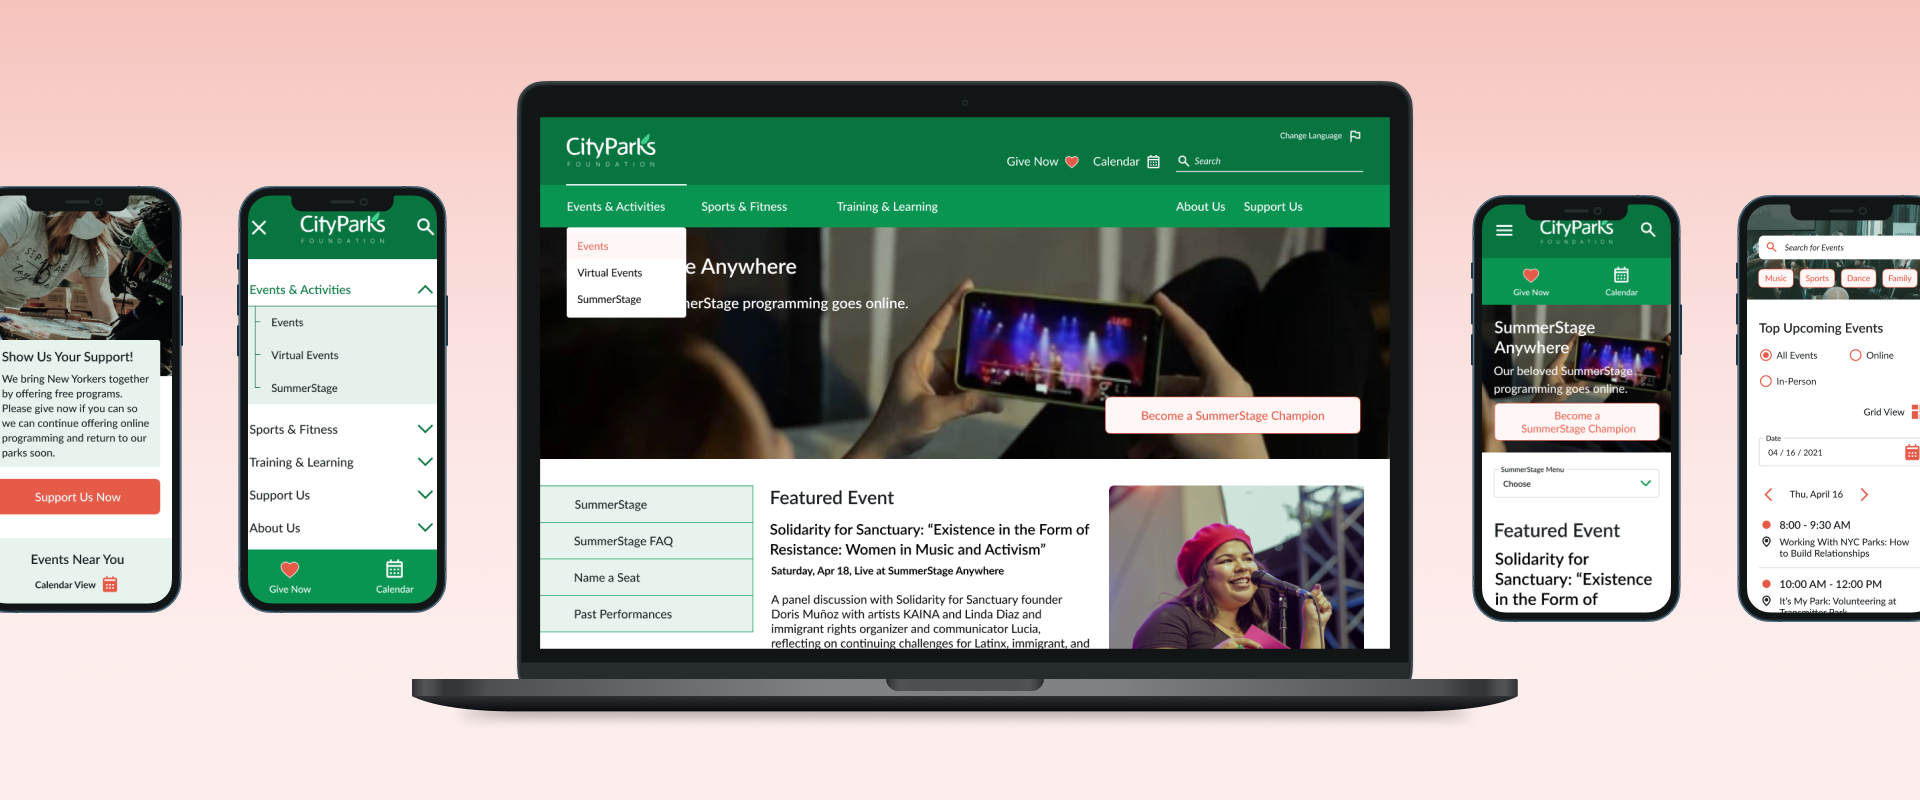
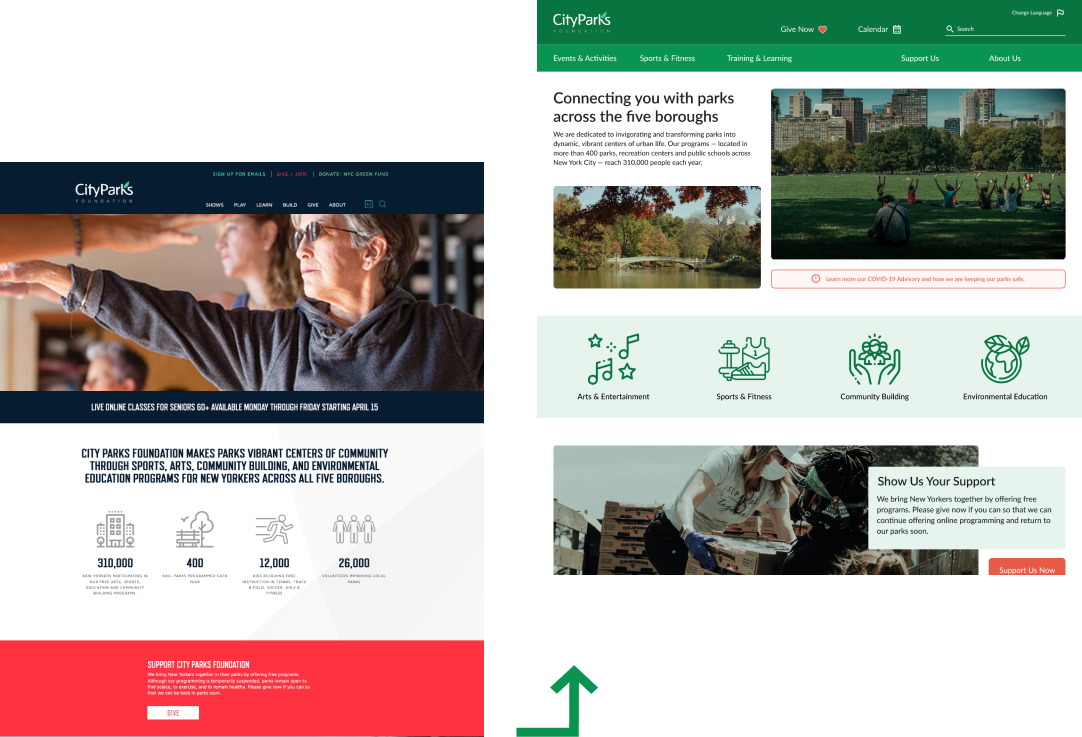
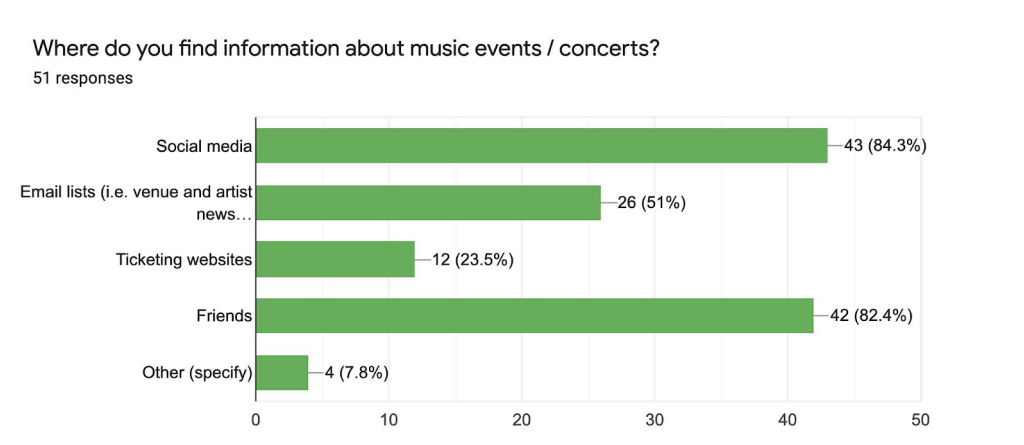
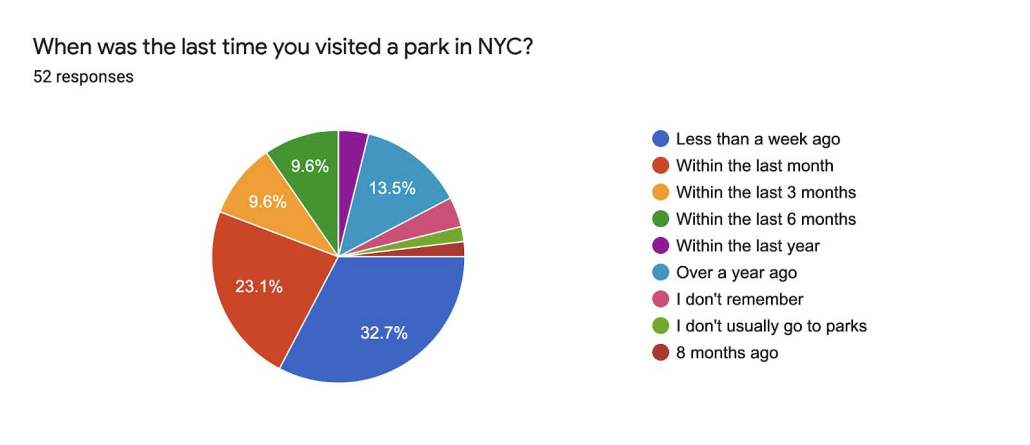
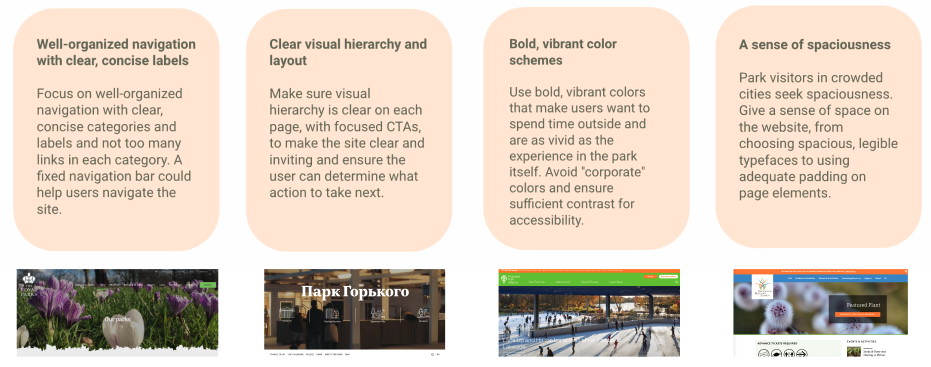
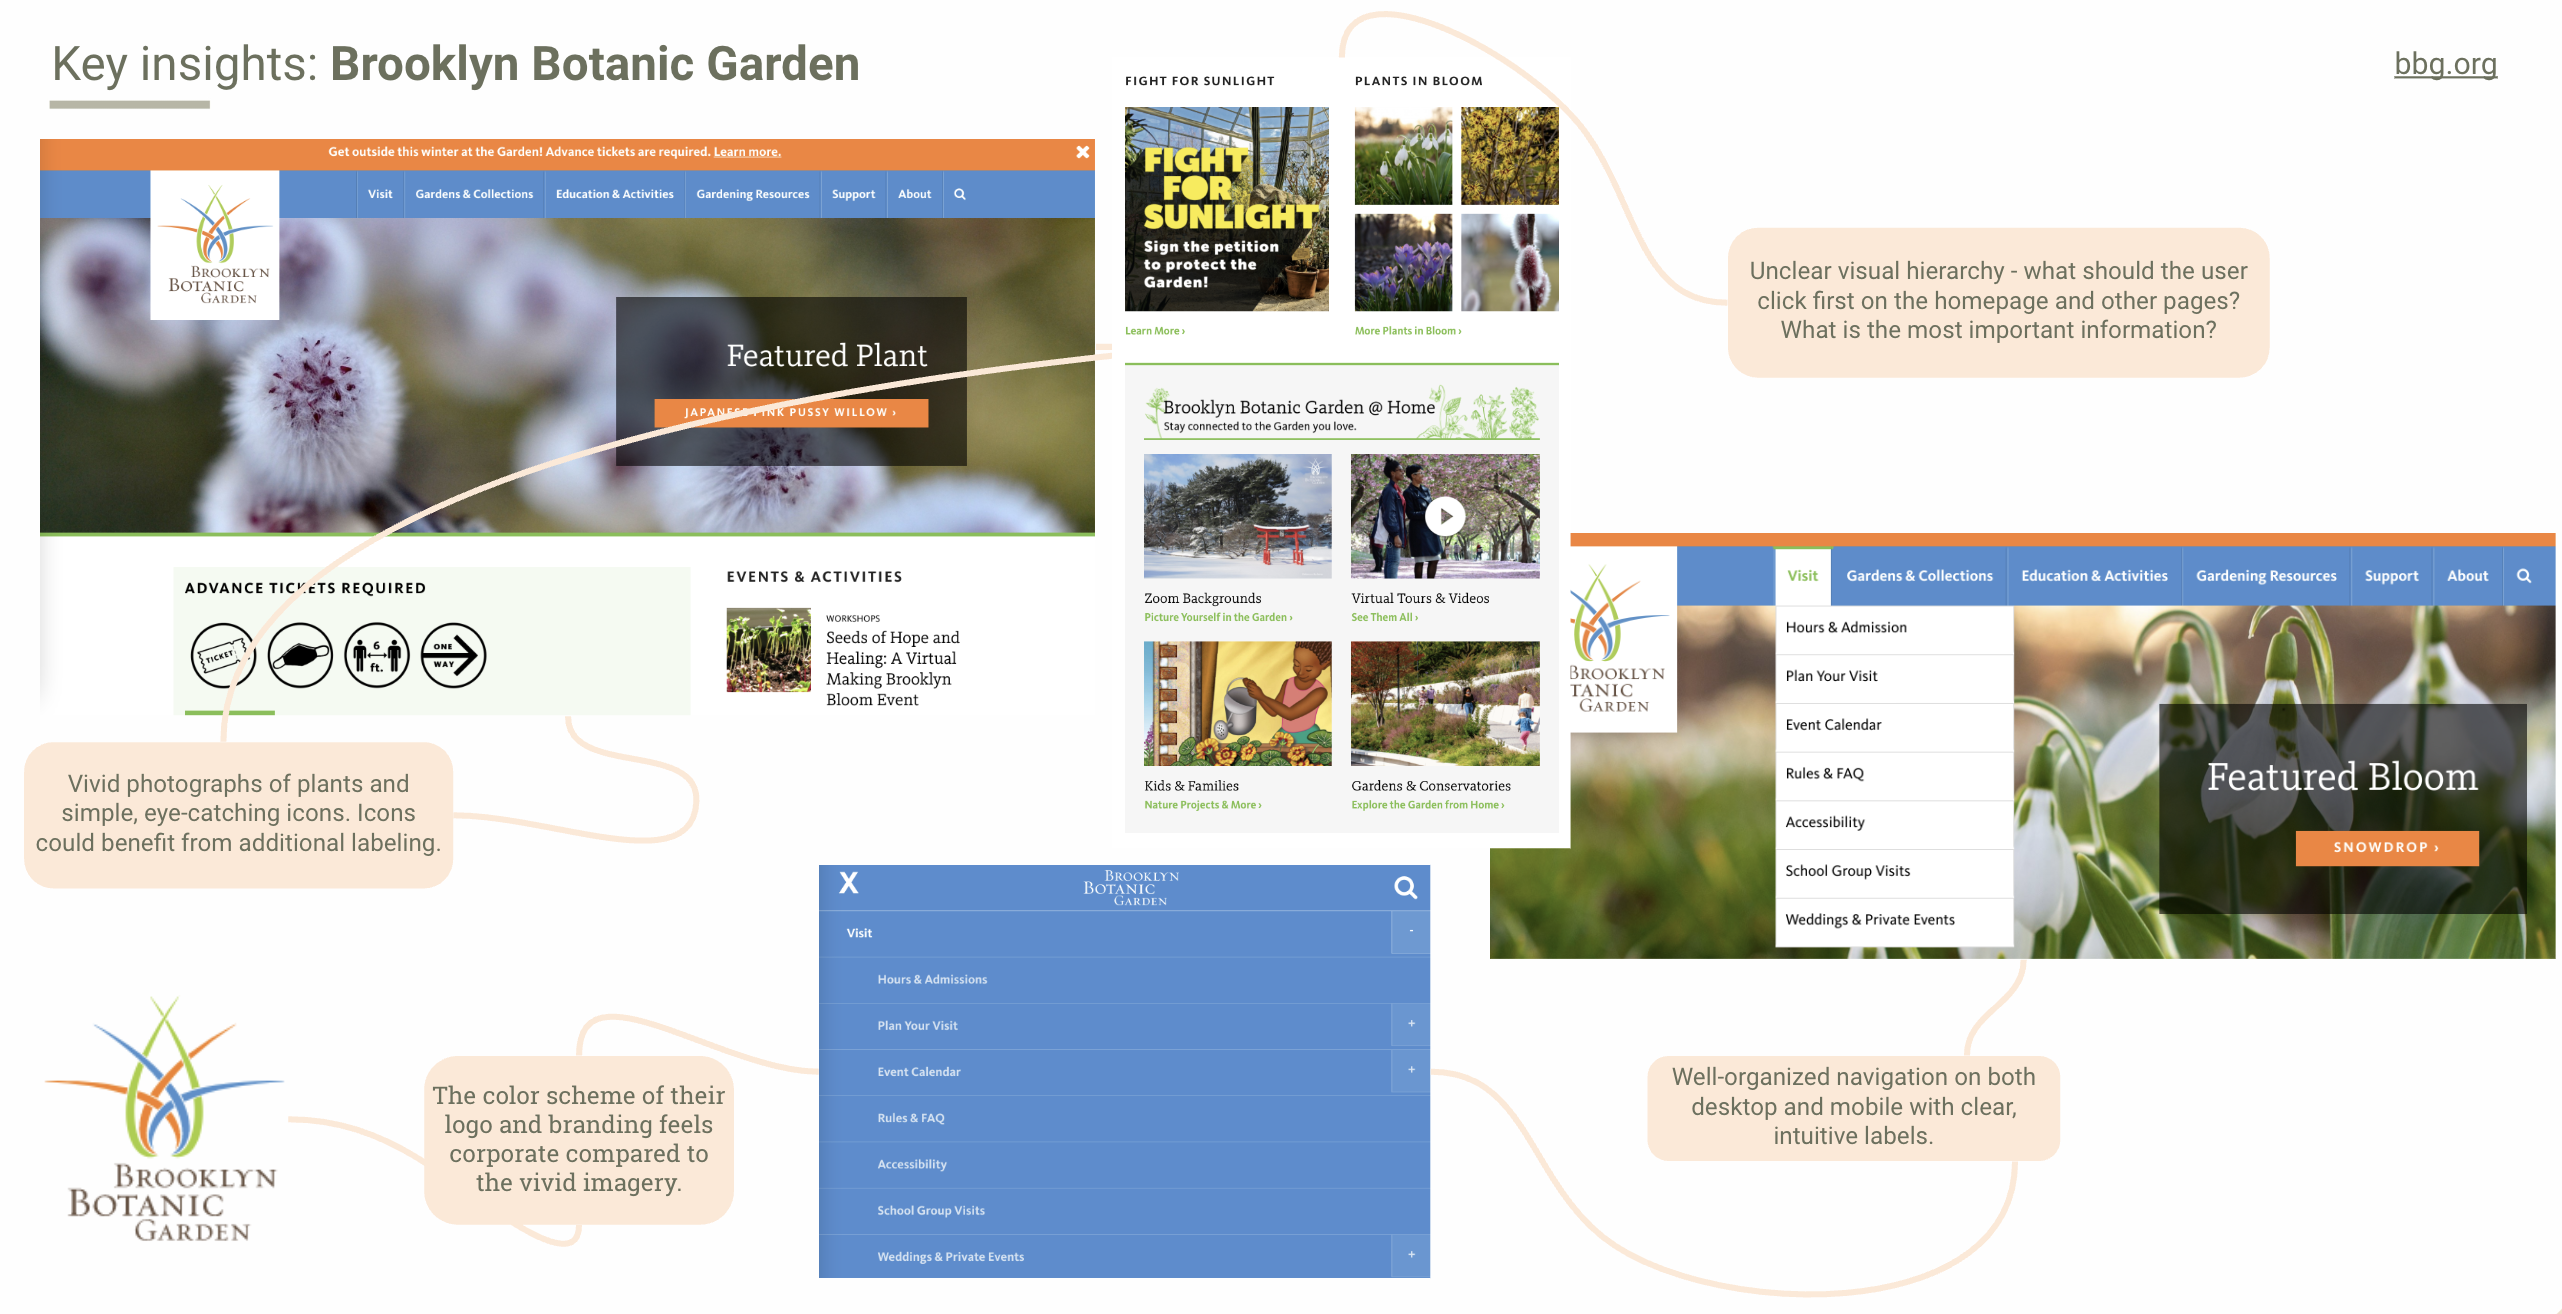
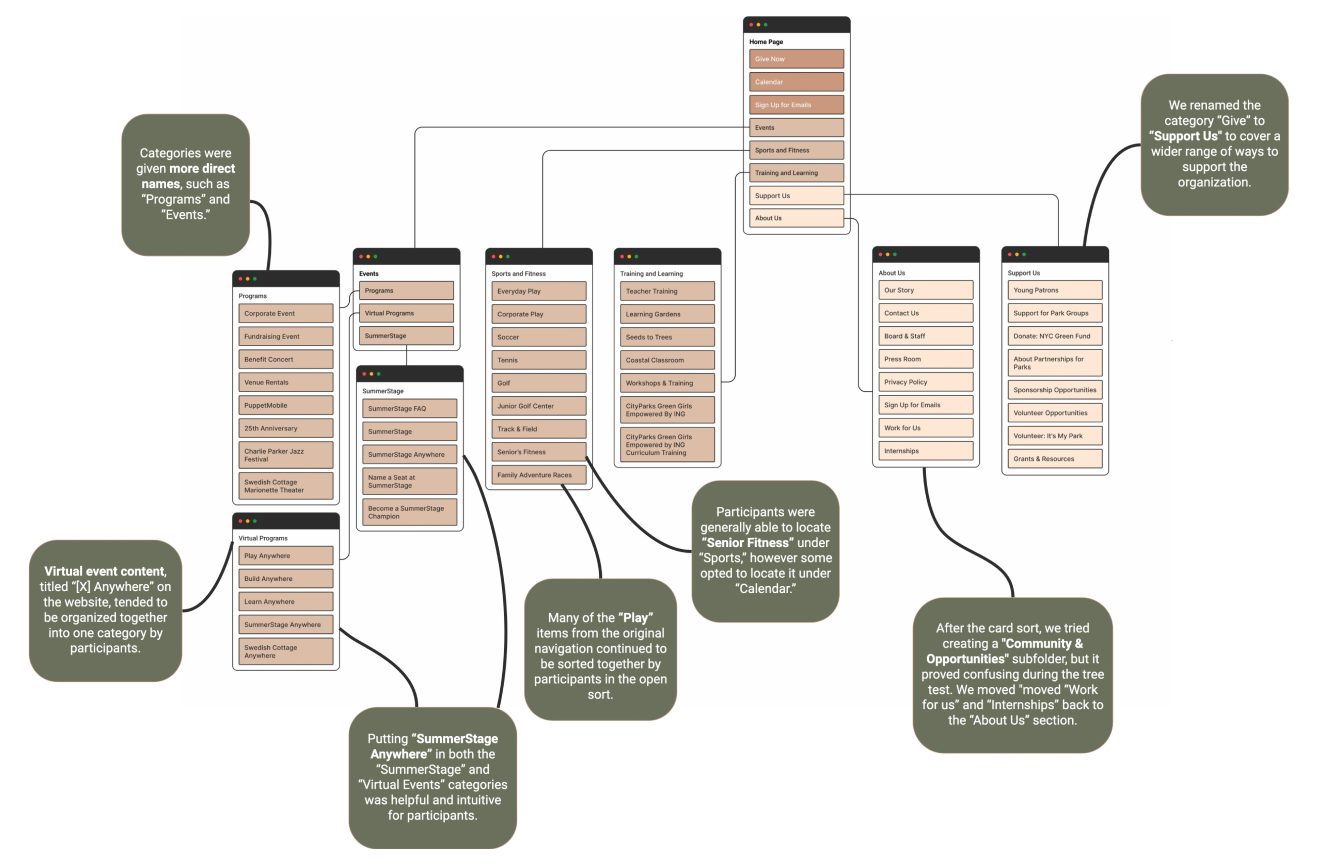
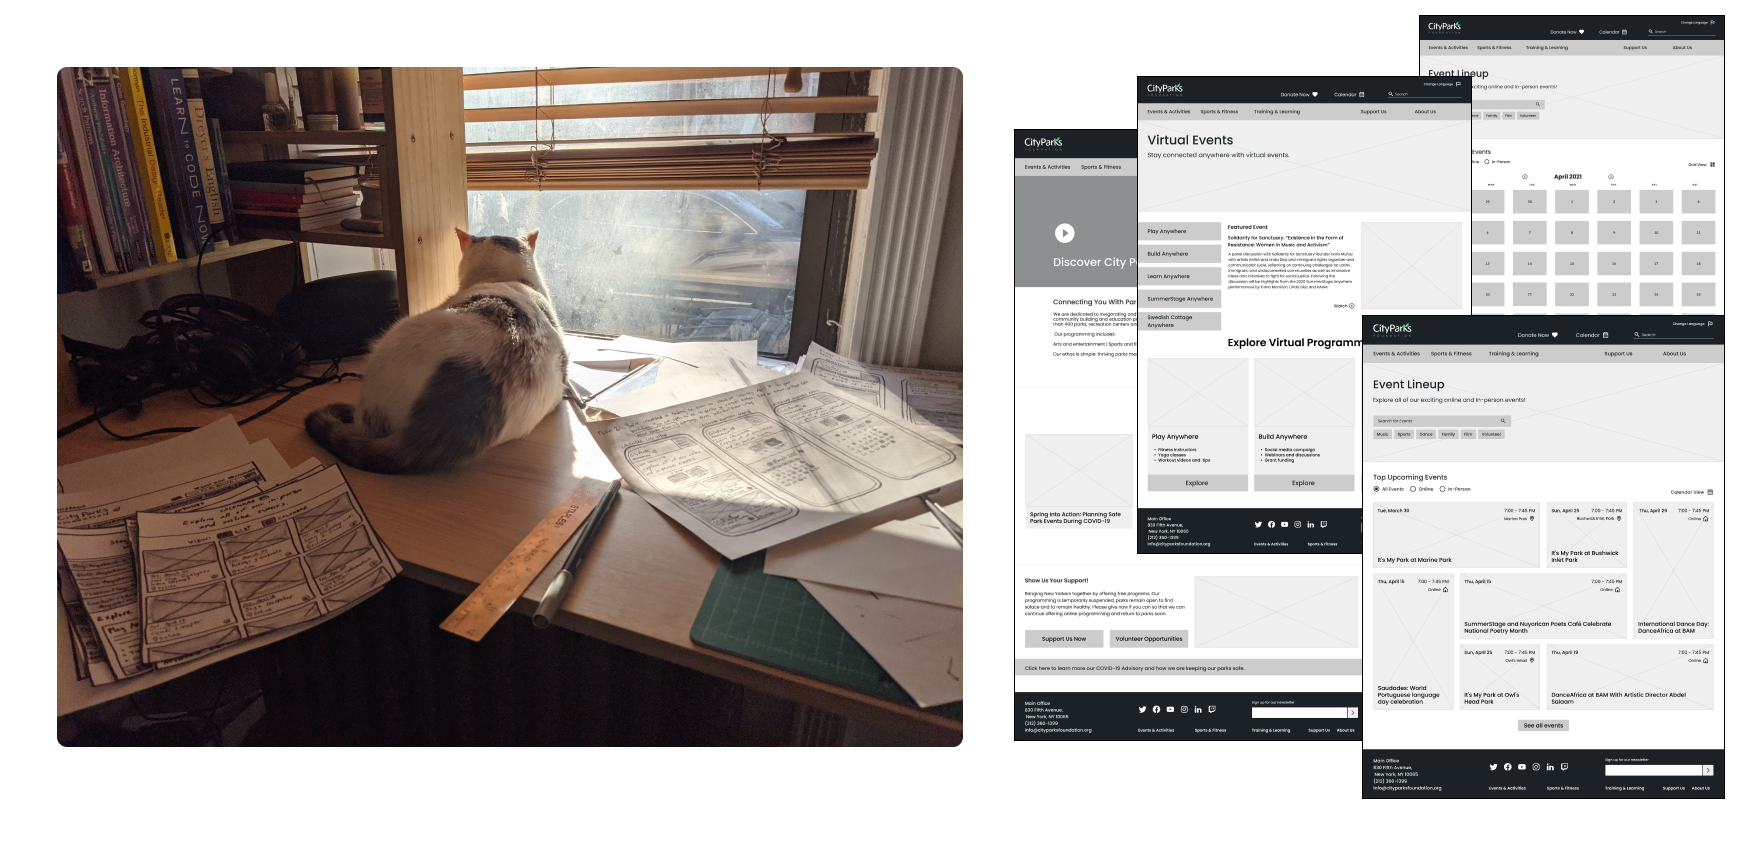
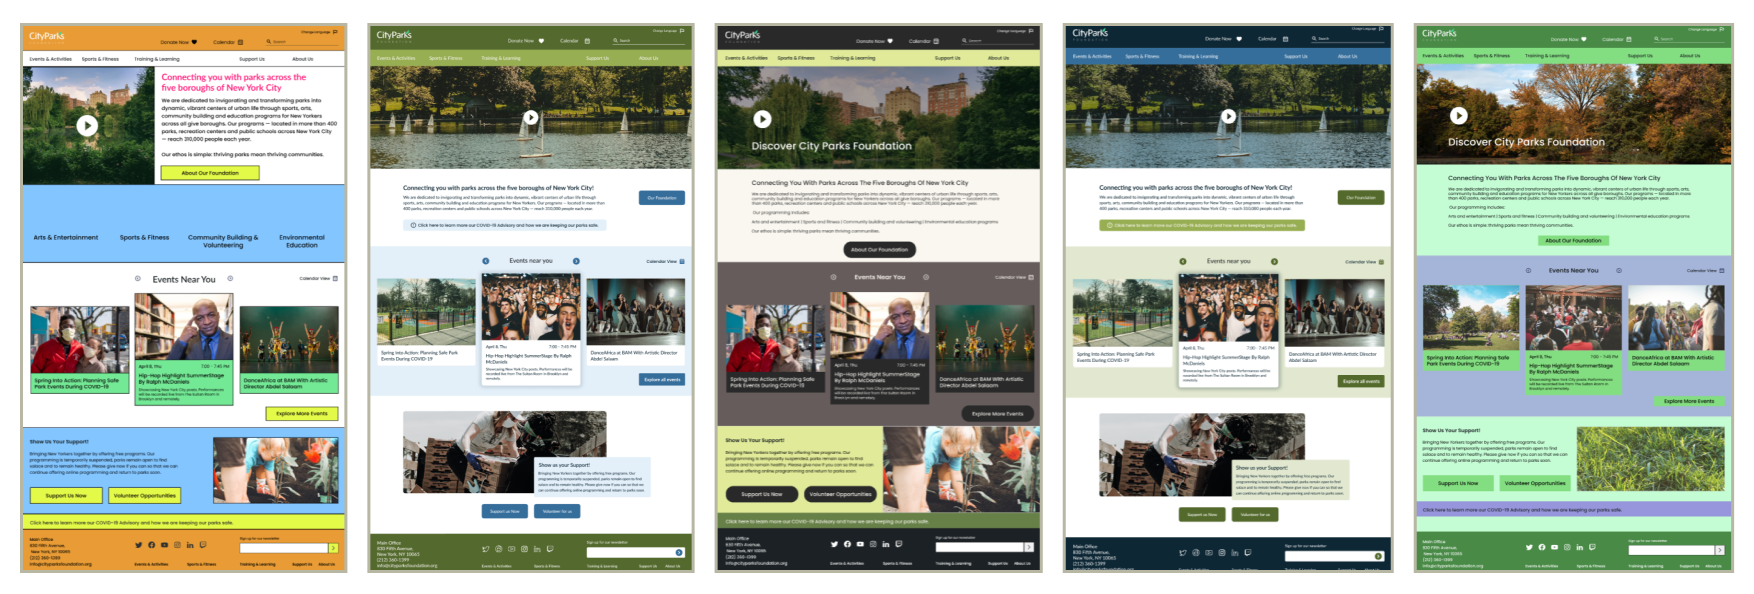
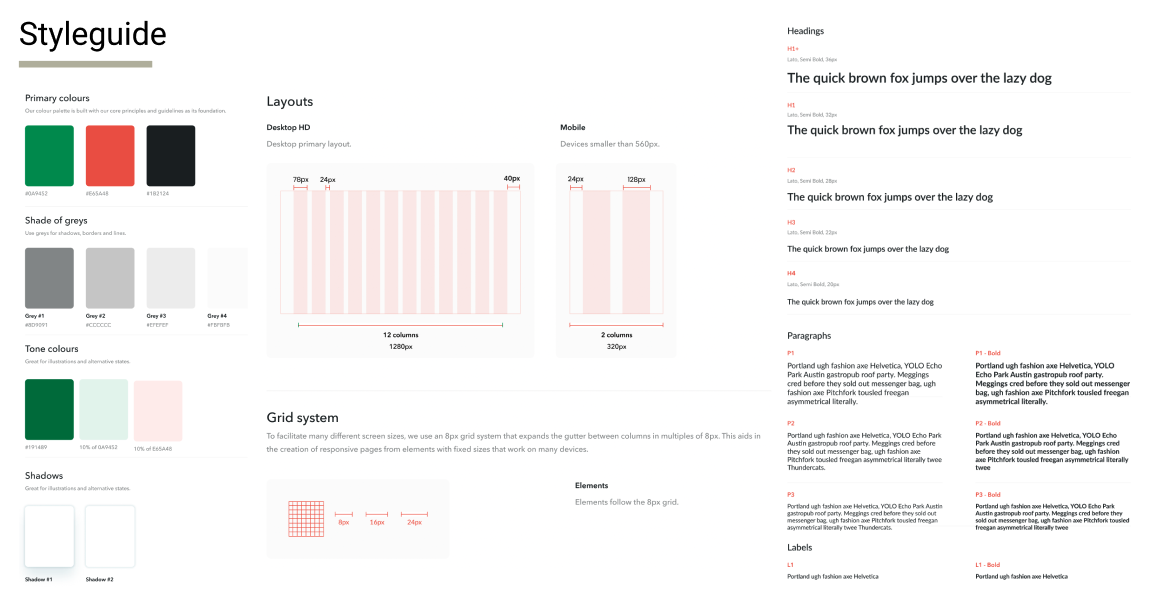
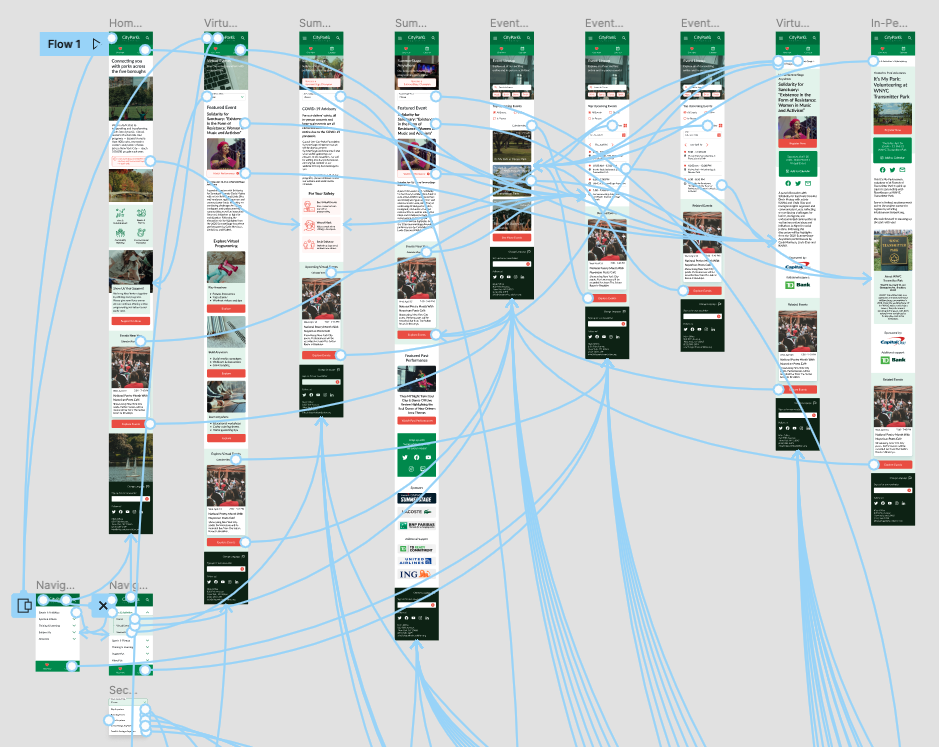
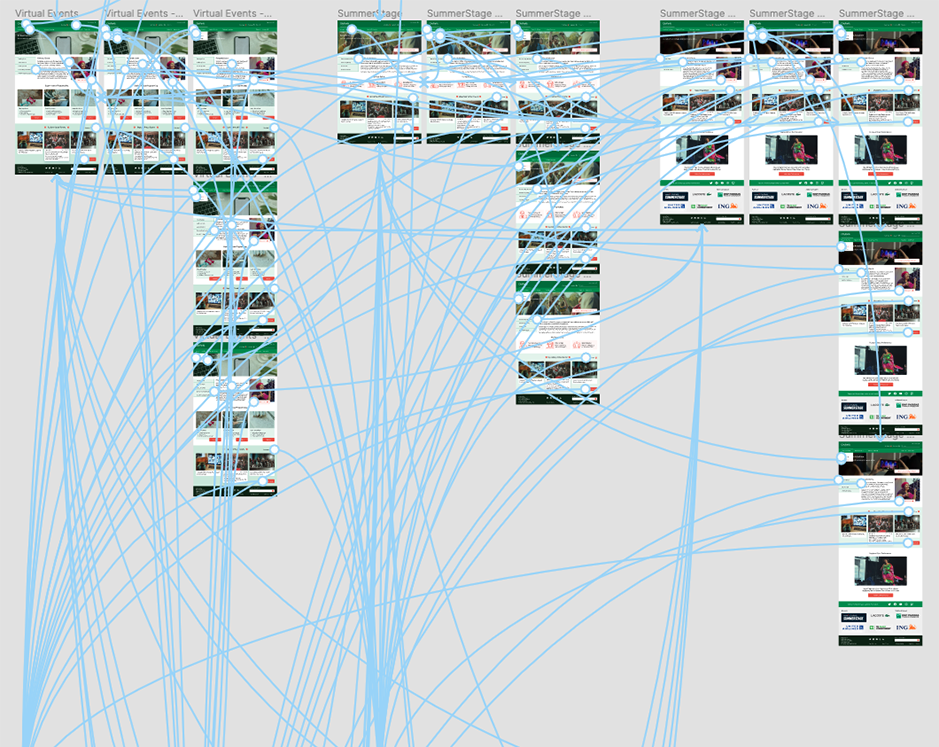
Over the course of several months, we completed generative research including a survey and interviews; card sorting and tree testing for a new information architecture, competitor analysis, a visual style guide, and multiple stages of prototypes leading to final interactive prototypes for desktop and mobile.

Explore Interactive Prototype Download PDF Presentation

Team / client

Pratt Institute - INFO-643
Information Architecture & Interaction Design

My role

  • User interviews & survey
  • Card sorting
  • Competitor analysis
  • Paper prototypes
  • Medium-fidelity wireframes
  • Interactive prototypes

Timeline

February - April 2021
3 months

Tools Used

  • Figma
  • Optimal Workshop
  • Google Forms
  • Photoshop

UX DesignInteraction DesignInformation Architecture


Project Goals

Make the CityParks Foundation website feel relevant to a millennial, concertgoing crowd, with a design that will work during and after the COVID-19 pandemic.

Over the course of the semester, our group set out to understand how millennials might use the City Parks Foundation website, to see what improvements could be made to the design and information architecture, and to imagine how we might highlight the foundation's event offerings for a young, concertgoing audience.

Competitor analysis: Brooklyn Botanical Garden


User Research

For our initial generative research report, we conducted interviews and a survey. The survey focused on gathering quantitative data, while the interviews focused on gathering narrative data about the participants’ experiences when visiting the parks. We worked on these questions together and created one form and one interview script to work from to simplify data collection and analysis.

Summarizing Our Results

Through our interviews and survey, we uncovered four key findings:

  1. Participants largely find information about concerts in public parks from social media and friends. According to the questionnaire, 84.3% and 82.4% of respondents stated they received information about concerts from social media and friends, respectively. These findings suggest that one of the challenges of the web redesign will be making the website feel relevant to a group that may rely on more social sources of sharing information.
  2. Before the pandemic, 88.5% of participants would attend outdoor concerts at least once every few months (during weather appropriate months). This finding demonstrates that our participants are interested in outdoor concerts, and that the possibility of using the website to draw attention to other outdoor activities is realistic.
  3. Many participants expect to find historical information and maps of the park on the city park website. The questionnaire results concluded that the participants largely expect to find maps of the park, history about the park, and logistical information such as the location of bathrooms, hours of operation, accessibility information on a park website.
  4. Within the past few months, 55.8% of the respondents had been to a park in NYC. More than half of the questionnaire participants had been to a public park within the past month, with 32.7% of the participants having been to a park within the past week. These findings suggest that regardless of season, parks are frequently visited by this demographic.
Survey results
Survey results

We also summarized our findings in a storyboard, user journey map, and persona, developed as an aggregate of our survey and interview data. I personally focused on developing and illustrating the storyboard.

Storyboard
Persona
Journey map

Competitor Analysis

As a group, we completed a competitor analysis of other sites in the same space, starting with a broad survey of existing sites, then narrowing in on four separate websites, with each group member focusing on one site. I focused on the Brooklyn Botanical Garden website. After completing individual analyses, we summarized our takeaways into four key findings.

Competitor analysis: Key findings Competitor analysis: Brooklyn Botanical Garden

Information Architecture

With the ultimate goal of creating a revised site map, we conducted a card sorting study and a tree testing study using Optimal Workshop to analyze our proposed changes to the existing structure of cityparksfoundation.org.

Card Sorting

Before beginning to make revisions to the site map, we completed two separate card sorts to develop a broad understanding of user preferences for the navigation. A closed sort afforded us a more controlled user testing environment, while an open sort offered a deeper understanding of how participants imagine the website's navigation bar. This also gave us higher confidence in the categories that appeared consistently across both sorts. We recruited 6 participants for the closed sort and 8 for the open sort (a total of 14 participants).

Tree Testing

Tree testing helped us determine the efficacy of our proposed changes to the City Parks website. We asked 8 participants to complete three tasks related to finding information based on our first draft of the site map.

A revised site map

Prototypes

Paper Prototypes and Initial Wireframes

To test our information architecture, we created paper prototypes for two tasks in desktop and mobile, which I drew and set up as interactive prototypes (desktop, mobile) in Figma. We tested the paper prototypes with 8 participants to get an initial sense of how our navigational structure was working.

We noted that most users tend to prefer or seek out the calendar view for finding an event for a specific date, and that confusion arose when there was duplicate or redundant information on a page. Personally, I came out of this feeling like I would have rather started by making low-fidelity prototypes in Figma since we were working remotely due to pandemic times and needed to make a digital prototype for participants to test anyway, but the process of working with pen and paper could be useful in other scenarios.

From here, we created medium-fidelity prototypes in Figma. I helped teach some of the group who didn't have experience using it before how to set up wireframes, and the visual designer in the group and I helped tidy up the work.

Paper prototypes and medium fidelity prototypes

Interactive High-Fidelity Prototype

After our medium fidelity prototypes were completed, we moved on to begin work on our final, high-fidelity interactive prototype. The group experimented with different color schemes and ideas in Figma.

5 wireframes with different color schemes applied

We discussed our options as a group, and our visual designer created a unified style guide. We settled on greens to give a sense of spaciousness and greenery - with a pinkish hue as an accent to create some contrast and make the layout feel less monochromatic and create some vibrant appeal for a millennial audience.

Style guide

After we applied the style guide to the wireframes and the visual designer added final polish, I built out the interactive prototypes for desktop and mobile in Figma. Because of our class time constraints, we focused on specific pages for two specific task flows, rather than a redesign of the entire website.

Paper prototypes and medium fidelity prototypes
 

Conclusion

This project gave our group an exhaustive view of the interaction design process and common tools: initial survey and interview research to understand a specific user demographic; examining related websites; using card sorting and tree testing to evolve the site map and information architecture; and creating and testing desktop and mobile prototypes of multiple levels of fidelity.

Explore Interactive Prototype Download PDF Presentation